Delaware.gov Logo
Delaware.gov Logo Text
My Healthy Community: Delaware Environmental Public Health Tracking Network

Search for your community or a topic

Enter your county, ZIP code, census tract, etc

Search for topics like Asthma or Drug Overdose Deaths

Selected location:

Climate Vulnerability & Risk

Data are current as of 2023

Most recent dashboard update: 12/5/2022

What is climate change?

Climate change refers to long-term changes in the average weather patterns in an area. This can include changes in average temperatures, rainfall patterns, and more. Some of these changes, such as higher summer temperatures and more extreme storms, can put people's health at risk. Visit DNREC's Climate Change Basics page to learn more about climate change and its causes.

The effects of climate change are already notable in Delaware, and more impacts are expected in the future. In this dashboard, we highlight different risk factors that can make areas more vulnerable to climate change and its effects.
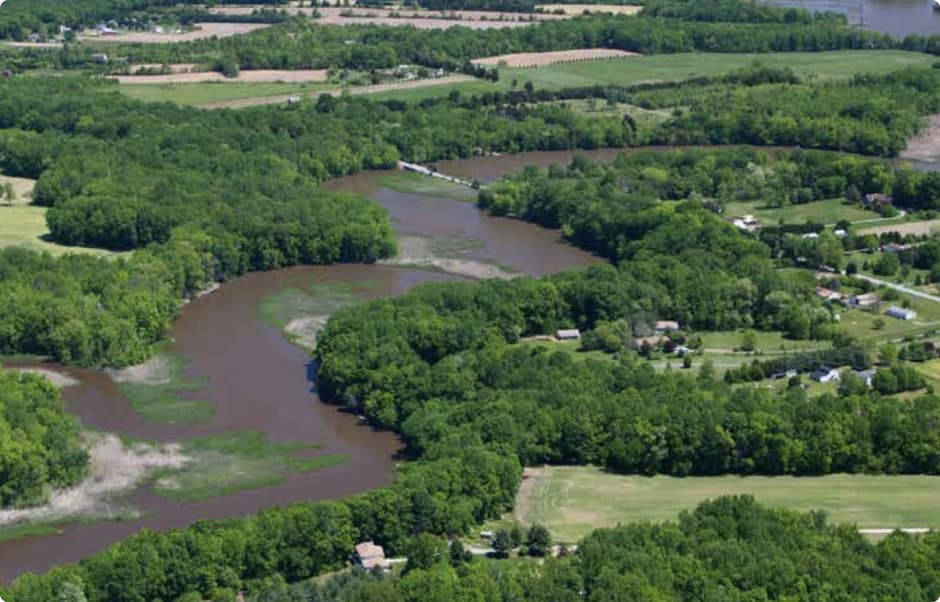
Aerial view of revier
Photo credit:Eric Crossan

Flood Zones


Sea level rise, along with an increase in the frequency and intensity of heavy rains, can contribute to a higher risk of floods. As the lowest-lying state in the nation, Delaware is uniquely vulnerable to flooding.

Floods can directly and indirectly impact human health. Exposure to floodwaters can result in injury or potentially death from various hazards. In the aftermath of a flood event, exposure to contaminated flood water may lead to illness (including infections, rashes, and tetanus).

For more detail on how special flood hazard areas are determined visit FEMA's website.

Changing the map
Using the toggles below select the land cover indicator type that you would like to see displayed on the map.

Land Cover


Land cover is defined as the types of surfaces, vegetation, or built environment that make up the land surface in an area. For instance, forests, wetlands, agricultural fields, and impervious surfaces such as concrete would all be types of land cover. Different land cover types can have heating or cooling effects and various capacities to absorb water in the event of flooding, making them essential factors in determining how vulnerable communities are to climate change.

Development cover is a measure representing the relative warmth of a city compared with surrounding rural areas, while percentage of tree canopy cover is a measure representing the cooling effect that trees and vegetation cover have on the relative warming of a city compared with surrounding rural areas.

Changing the map
Using the toggles below select the land cover indicator type that you would like to see displayed on the map.

Climate Projections

Data are current as of 2023

Most recent dashboard update: 12/1/2022

Understanding Climate Projections

With increased concern regarding climate change and its effects on local environments, the State of Delaware's Department of Natural Resources and Environmental Control (DNREC) conducted a climate projections study for Delaware. The DNREC study provides predictions of changes in Delaware climate throughout the 21st century. This page shows some of the climate projections from the DNREC study, including the number of nights annually with a temperature above 80º F; the number of days annually with temperature above 90º F, 95º F, and 100º F; and the average daily high temperature projections.

The State of Delaware's Department of Natural Resources and Environmental Control (DNREC) worked with leading climate scientists to create climate projections for Delaware. To create the climate projections, researchers coupled over 100 years of Delaware weather station observations with climate model simulations of projected future climate conditions through the end of the 21st century.

Not all communities feel the impacts of climate change equally. Low-income communities, for instance, may struggle with high energy bills during the hottest parts of the summer, while elderly and disabled individuals are more vulnerable to the health effects of extreme heat waves. The Social Vulnerability Index (SVI) is a resource created by the CDC to identify communities that may need greater support.

More information about the data presented in this section can be found at the Climate Projections Portal.

Projected Temperature Increases


Daytime Temperature

The average annual number of days with temperatures above 90º F, 95º F, and 100º F and average daily high temperature are both expected to increase in Delaware. Hot temperatures can also contribute to deaths from heart attacks, strokes, and other forms of cardiovascular disease. Heat is the leading weather-related contributor to deaths in the United States, even though most heat-related deaths are preventable through outreach and intervention

According to the CDC, elevated temperatures increase the risk of heat-related illnesses and deaths, particularly among vulnerable populations, such as children, older adults, economically disadvantaged groups, and those with chronic health conditions made worse by heat exposure.

Homes near coast
Photo credit:Gökhan Kara

Projected number of days annually with temperature above 90°F

Projected average daily high temperature (°F) (high emissions scenario)

Night Time Temperature

In the future, average temperature and temperature-related indicators are expected to increase across Delaware.

The average annual number of nights with a temperature about 80° F is expected to increase annually in Delaware.According to the CDC, people can face serious health risks if they cannot recover from exposure to daytime heat. The average annual number of nights with a temperature above 80° F is expected to increase annually in Delaware. While daytime high temperatures are typically hotter, many environmental health scientists are increasingly concerned about high nighttime temperatures. When the body can’t cool down at night and recover from exposure to daytime heat, the risk of heat-related illness increases.

Night sky with stars and silouetted mountains
Photo credit:Vincentiu Solomon

Projected number of nights annually with temperature above 80°F

Tick-Borne Illness

Data are current as of 2023

Most recent dashboard update: 10/28/2021

Understanding tick-borne illnesses

Changes in the environment can impact the vectors (e.g, ticks) that spread tick-borne diseases such as Lyme disease. According to the CDC, the reproduction and survival of ticks, their animal hosts (e.g., deer), and the bacterium that causes Lyme disease are influenced by climatic factors such as temperature, precipitation, and humidity. Mild winters, early springs, warmer summers, and fewer days of frost allow ticks more time to reproduce, spread disease, and expand their habitats. Increases in the tick population may increase the risk of Lyme disease in areas where Lyme disease already exists. For more information on Lyme disease and the impacts of a changing climate, visit CDC: Climate Change and Infectious Disease.

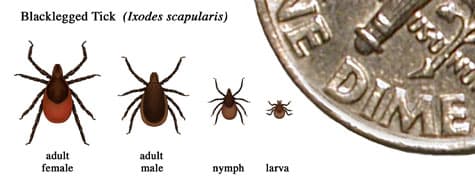
Images of Blacklegged Tick in different phases of life and how their sizes compare to a dime
Photo credit:CDC
Delaware

Lyme Disease Incidence

2023

42.8
age-adjusted rate per 100,000 people
decreased 18% from 2018 to 2023

Climate and Health Outcomes

Data are current as of 2023

Most recent dashboard update: 5/29/2024

Climate and Health Outcomes

Climate change impacts human health by putting people at risk of injury, disease, and death from exposure to intense heat waves or extreme heat events and other extreme weather. Extreme weather puts stress on the body, especially among older adults and individuals with pre-existing conditions and chronic illnesses. Extreme heat can affect people directly in the form of heat stroke or heat exhaustion, but it can also worsen heart and lung conditions, which can lead to hospitalizations associated with myocardial infarction and asthma exacerbation. Dehydration associated with extreme heat can also worsen kidney conditions.

When fossil fuels are burned, in addition to greenhouse gases, air pollutants such as sulfur dioxide, particulate matter, carbon monoxide, and more are released into the air. These are often called co-pollutants, because they are released at the same time as carbon dioxide. Co-pollutants can also affect human health. Exhaust from car traffic, for instance, can trigger asthma attacks. Below are a sample of health metrics related to extreme weather and co-pollutants.

Hospitalizations


Hospitalization or hospital discharge refers to any discharge from a non-federal, short-stay, acute-care hospital in Delaware. Hospitalizations are expressed as numbers of discharges, not as unduplicated patients. As a result, a single patient with multiple hospitalizations can be counted more than once. Delaware hospital discharge data are based on inpatient hospitalizations and do not include outpatient, clinic, or emergency room data.

Table Key
Indicator

Delaware

% Change
Trendline
State

Target

Myocardial Infarction Hospitalizations

age-adjusted rate per 100,000 people

104.7

(2022)
Decreased 16%(2017 to 2022)
Loading...

104.7

N/A

Carbon Monoxide Poisoning Hospitalizations

age-adjusted rate per 100,000 people

2.9

(2016)
Decreased 3%(2011 to 2016)
Loading...

2.9

N/A

Heat Stress Hospitalizations

age-adjusted rate per 100,000 people

3.0

(2016)
Decreased 92%(2011 to 2016)
Loading...

3.0

N/A

Asthma Hospitalizations

age-adjusted rate per 10,000 population

4.9

(2021)
Decreased 58%(2016 to 2021)
Loading...

4.9

N/A

Deaths


Table Key
Indicator

Delaware

% Change
Trendline
State

Target

Carbon Monoxide Poisoning Deaths

age-adjusted rate per 100,000 residents
N/AN/A
N/A

Heat Related Deaths

age-adjusted rate per 100,000 residents
N/AN/A
N/A

Asthma Deaths

age-adjusted rate per 10,000 population

2.8

(2016)
Decreased 10%(2011 to 2016)
Loading...

2.8

N/A

Additional Information

Climate and Health in Delaware

Resources


DNREC's Climate Action Plan

Delaware's Climate Action Plan, which is the result of a year-long process involving residents, businesses and technical experts, is a roadmap for how the state can prepare for climate change in the decades ahead.

Delaware Climate Office website

Office which houses the State Climatologist

Delaware Climate + Health Report (PDF)

Summary Report from the 2017 Delaware Climate Health Conference.

DNREC Tick Program

Includes a form for reporting tick interactions.

CDC page on flooding

Learn how to prepare for a flood, stay safe during a flood, and protect your health when you return home after a flood.

CDC page on extreme heat

This website provides helpful tips, information, and resources to help you stay safe in the extreme heat this summer.

FEMA National Risk Index

Discover the landscape of natural hazard risk in the United States.

Data Sources


Delaware Climate Change Projections

Citation: Delaware Department of Natural Resources and Environmental Control (DNREC). Delaware Climate Predictions Portal. Retrieved from http://cema.udel.edu/applications/declimateprojections/about/

Hospital Discharge Data

Citation: Delaware Health and Social Services. 2015-2022. Hospital Discharge Data.

Lyme Incidence

Citation: Delaware Department of Health and Social Services. https://myhealthycommunity.dhss.delaware.gov/

Mortality

Citation: Delaware Department of Health and Social Services, Division of Public Health, Delaware Health Statistics Center.

National Land Cover Database

Citation: Dewitz, J., and U.S. Geological Survey, 2021, National Land Cover Database (NLCD) 2019 Products (ver. 2.0, June 2021): U.S. Geological Survey data release, https://doi.org/10.5066/P9KZCM54

US Buildings in Flood Zones

Citation: Bing Maps Team. Computer Generated Building Footprints for the United States. 2018. Retrieved from https://github.com/microsoft/USBuildingFootprints and Federal Emergency Management Administration. Flood Map Service Center, 2022. Retrieved from: https://msc.fema.gov/portal/advanceSearch#searchresultsanchor

US Geological Survey Science Data Catalog

Citation: Falcone, J.A., 2016, U.S. block-level population density rasters for 1990, 2000, and 2010: U.S. Geological Survey data release, http://dx.doi.org/10.5066/F74J0C6M.

Privacy


In releasing this information, Delaware aims to provide information that can be helpful to local communities as they work to improve public health. However, the protection of the confidentiality of our citizens is of paramount importance. To that end, counts of less than 11 are not presented. An outside expert has reviewed the platform to ensure it complies with the HIPAA privacy rule (45 CFR 164.§514(b)).